Vibrating Membranes and Fancy Animations
In my robotics post of the linear harmonic oscillator, I had included a GIF animation of the first sixteen normal modes of a circular vibrating membrane, as an illustration of an analytical theory for the sloshing dynamics of fluids. It looks something like this:
I had promised in that post that I would discuss the physics of vibrating membranes, and that I would explain how I'd generated those animations. Here it is.
I would first have to disappoint you—it's not as if I'd discovered something ground-breakingly new about vibrating membranes, say, that it contains some mysterious insights on dark matter. The physics here is the same old stuff presented in textbooks and lecture notes, and in fact there's a Wikipedia page on all these rubbery affair.
The Physics
Since the physics of oscillations and waves is so well-documented, we shall simply start with the classical wave equation. The derivation of this equation can be found easily elsewhere. We let u(x, y, z, t) represent the wave function—the height of the membrane in our case—and we also assume a two-dimensional circular membrane.
As with most things circular, it is more convenient to adopt a cylindrical coordinate system, and this transforms our wave equation. We also set the boundary condition that displacements must diminish—or equivalently there must be a node—at some radius a.
We now make a proposition that solutions to this equation is separable, meaning that u(r, θ, t) can be written as a product of separate functions of r, θ, and t. This assumption is defendable because we are seeking linear wave solutions, whose properties are independent in each of the variables. One may no longer be able to do this justifiably if the wave equation is changed to a non-linear one, say.
Substituting this into our wave equation and separating out time-dependent and time-independent terms, we obtain the following expression.
We argue that the left-hand side of the equation does not depend on r, and that the right-hand side does not depend on t, and therefore the fact that they are equivalent at all times implies that they are each constants. We call this constant K. We can now isolate the left-hand side of the equation.
There are three possible behaviors for this differential equation. If K is negative, then we obtain the characteristic equation of simple harmonic motion, and we deduce that the solution must be sinusoidal. If K is zero then the solution must be a constant or a linear function. And if K is positive then we obtain an equation with solutions that blow up exponentially. Only the first case is physically reasonable for our system; and therefore K must be a negative constant. This allows us to write K as the negative square of some constant, say, λ; writing the solution for T then becomes trivial.
Above we note that the λv argument is analogous to the angular frequency of the wave. We now examine the remaining right-hand side.
We make a similar argument, as we had previously done for the separated wave equation. The left-hand side of the equation does not depend on θ, and the right-hand side does not depend on r; and thus the fact that they are equivalent for all θ and r implies that they are each constants. Let us call this constant L.
Examining the right-hand side, we notice that it is, once again, an equation analogous to simple harmonic motion. We have the added constraint that solutions to this angular component must be periodic in 2π, since the membrane must be continuous and smooth everywhere, and every part of it, obviously, can only be in one place at any one time. This allows us to write down the solutions immediately.
We now examine the left-hand side.
This is a nonlinear second order differential equation that is not trivial to solve. We can, however, perform a little transformation, and we see that it matches the Bessel differential equation exactly; and this offers us analytical solutions in terms of Bessel functions.
The solution to the Bessel differential equation can be expressed as a linear combination of the Bessel function of the first kind, denoted J, and the Bessel function of the second kind, denoted Y. The subscript α is called the order of the Bessel function.
And therefore, our solution for R(r) can be written in a similar fashion.
At this point we have to take note of the properties of J and Y. The Bessel function of the first kind is an oscillatory function that remains bounded as its argument approaches zero; the second kind, however, grows unbounded. This is unphysical, for it implies our membrane would stretch infinitely near its center. We therefore conclude B must be zero.
Combining all our work thus far, we can obtain the general expression for the vibrational modes of an ideal circular membrane.
Our last step is to obtain an expression for λ. We recall our boundary condition of a node being present at radius a from the center of the membrane. This tells us that R(r) must vanish at radius a, which is only possible if argument λa is a root of the Bessel function. Bessel function J has an infinite number of roots; it follows that there is an infinite number of λ that satisfies this condition. We can denote these various solutions with the subscript n, such that each of them corresponds to the n-th root of the Bessel function.
We are now done. Our final set of equations can be written as follows.
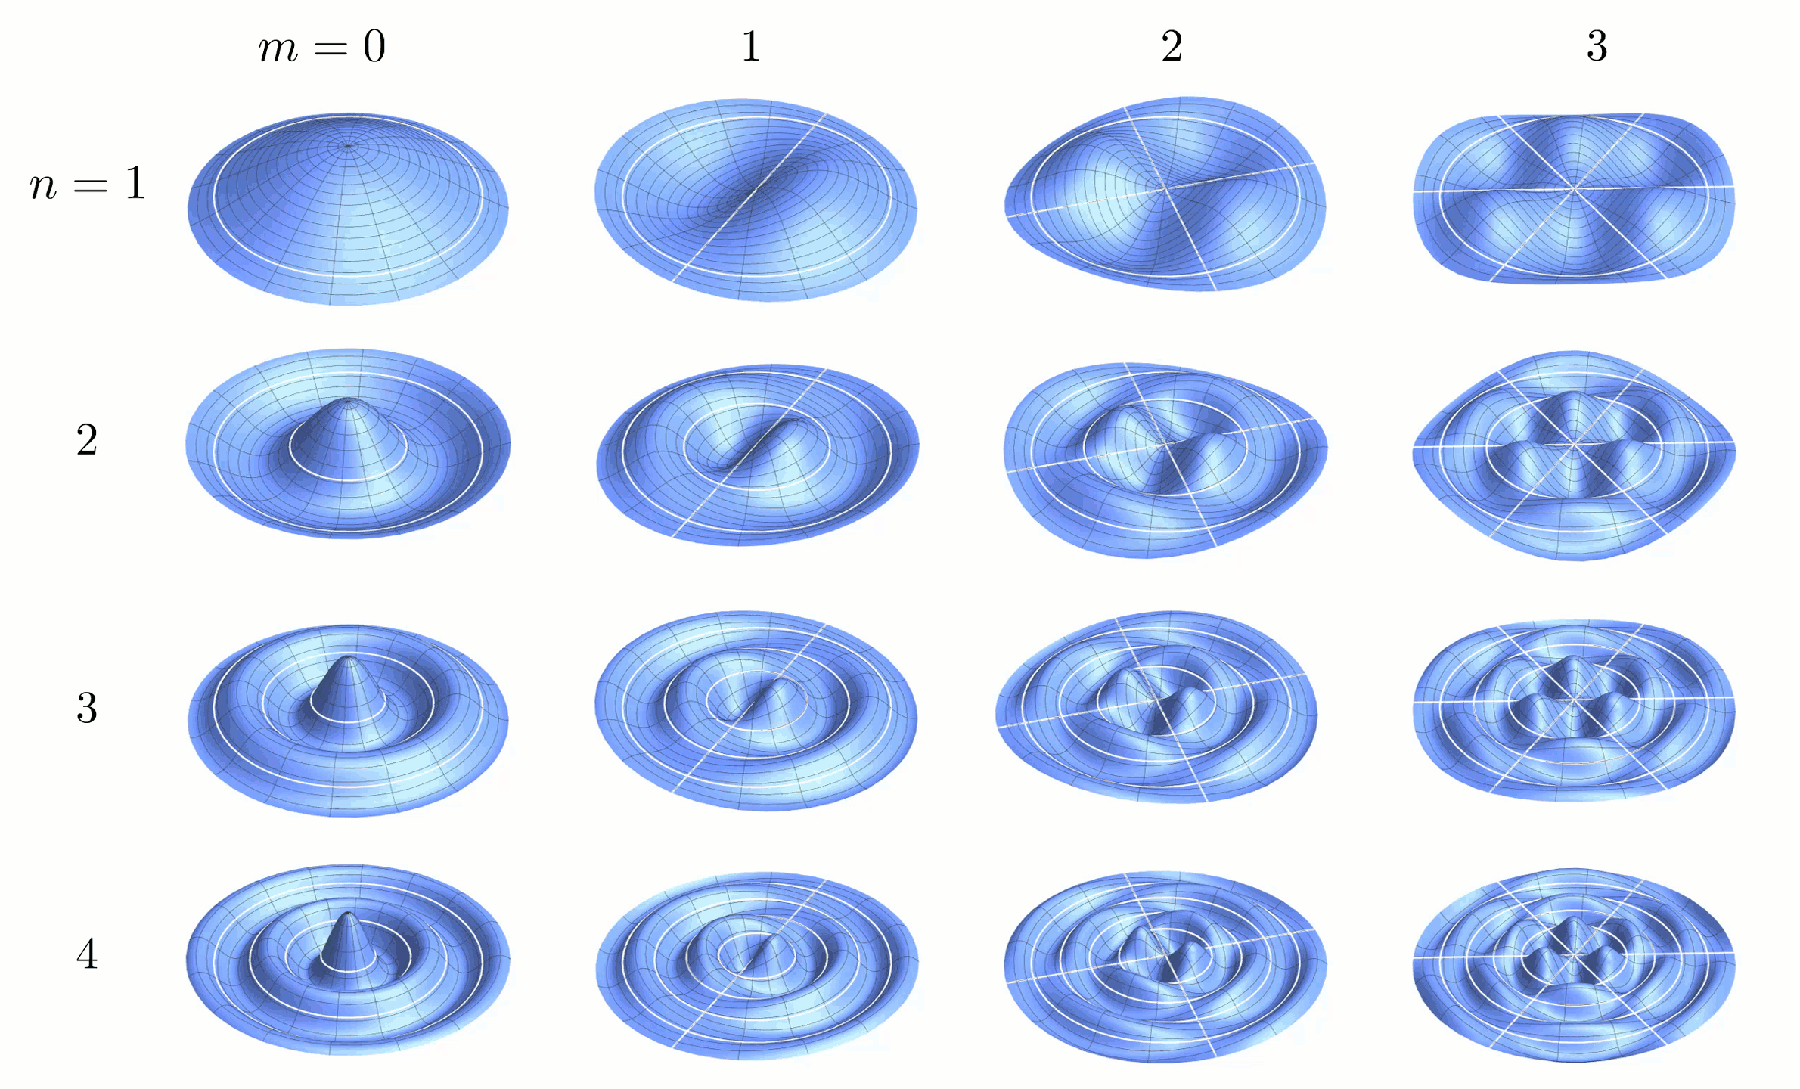
We note that we need two parameters, m and n, to fully identify each vibrational mode of the membrane. This is expected due to the two-dimensional nature of the membrane. Furthermore, from the derivation above, we can see that m determines the number of lines of symmetry of the vibrational mode, whereas n determines the number of radial nodes.
The Code
Now we can move on to generating the desired graphics programatically. Once again we make use of Mathematica.
There is one aspect of this that is worth mentioning. Because λ is different for different modes, the angular frequency of each of these modes would also be different. If we were to ignore this and animate our first sixteen modes all at once, the video will look incredibly disorienting to viewers, since the modes would all drift out-of-phase quickly. We therefore make a compromise between physical accuracy and aesthetics—we set the frequency of all modes to be the same.
Furthermore, we can set all phases ϕ to be zero. This does not mean that the graphics is physically inaccurate in additional aspects; it simply means that we have set a certain spatial rotation of the membrane, and a certain starting phase, time-wise. Since the oscillations are perfectly periodic, and we intend to loop our animation perpetually, the latter is of no significance.
We can write a Mathematica function, named Membrane here, to generate graphics of the vibrating membrane given mode parameters m and n, and the time t. We assign arbitrary values for amplitude A and boundary node radius a—since our animation is to have no displayed axes to indicate scale, the exact values of these are of little consequence. We can conveniently make use of the built-in BesselJZero function to evaluate λ, and we plot the membrane parametrically using Parametric3DPlot.

Notice that we force the evaluation of λ to return numerical results. This is because retaining a symbolic form of BesselJZero is extremely computationally intensive. Shaving off computational time here would do us well, especially since we will be generating hundreds, if not thousands, of frames for our animation.
Also notice that we plot beyond our outermost node a, by an arbitrary factor of 1.2. This is a personal preference, to show that the results do not necessarily apply only to membranes that are supported on its outer edges. The solution we derived applies, so long as the membrane is constrained to have a node at some a.
We see that calling this Membrane function indeed gives us the graphics we were expecting.
But this is not all that we want. We also wish to highlight the lines of symmetry and the positions of radial nodes, so that viewers are able to see the effects of changing m and n readily. To do this we envelope everything in a Show block, so that all individual plots are overlaid. Our first plot would be the membrane itself, made in a similar fashion as shown above; and we would overlay the lines of symmetry and radial nodes on top.
Finding the positions of all radial nodes is equivalent to finding all r such that λr is a Bessel root. If we denote the various r solutions with subscript i, we can write this condition as follows:
Next, the positions of the lines of symmetry. This is equivalent to finding all zeroes of f(θ), whose expressions can be derived through simple trigonometry.
Our revised code now looks like this.

Testing our revised Membrane function, we indeed see that the lines of symmetry and radial nodes are plotted correctly. One can notice some slight aliasing of the white symmetry lines—this can readily be fixed by calling the built-in anti-aliasing options in Mathematica. We shan't bother in this case, however, because the animations we seek to produce would be of too small a size for this to be easily noticeable.
To check that the graphics are indeed alright, and to visualize for oneself the results we had generated, one can use Manipulate with m, n, and t set as user-changeable parameters. One can then drag the slider bars and observe the dynamic graphics.

We can, of course, go ahead and place Membrane in an Animate block to generate an animation, and then call Export to write it to a video file. The issue with such a method is that video rendering is incredibly slow in Mathematica—much slower than professional video editing softwares.
We therefore choose a different approach. We render out all frames of the animations first, and then import them as image sequences into our video editing software. We utilize parallel computing for the generation of the graphics, to speed things up; and we use a Monitor wrapper coupled with ProgressIndicator in order to display a progress bar while Mathematica grinds through the frames.

Above we have chosen a frame rate of 30 frames per second. We make use of a variable called counter to track compute progress over all our parallel threads; and for that purpose it is important to declare it as a shared variable, so that the same variable instance is updated by all threads. Else each thread would update its own instance of counter, and the front end would never be able to display progress properly.
Granted, this stores all generated imagery in random access memory, so this approach will not work if one wishes to scale the rendering up significantly—for hundreds of modes, say. For larger rendering batches, a better alternative would be to generate the imagery and then immediately export them, so that they are not kept in memory.
The next time is to export the generated frames. Once again we launch a progress bar to keep track of the execution.

And this completes the code. What remains to be done is a little bit of video editing, and the export of the completed animation in GIF format, so that it can be uploaded conveniently.
Video Editing
There are many ways to build the four-by-four animation; one doesn't have to do it the way I did. This is simply a workflow I had gotten used to.
The good thing about Vegas Pro is that it allows explicit pixel-by-pixel control over the scaling and positioning of video tracks. To preserve sufficient resolution for the mode shapes and white highlights to be seen, we desire each animation to measure 576 by 360 pixels. This means the entire four-by-four animation grid would measure 2304 by 1440 pixels, an aspect ratio slightly narrower than widescreen format. We can easily scale it to widescreen by adding white-space, when we add the m and n labels later on.
The animation frames we had exported were of dimensions 1600 by 1466 pixels; after cropping the white-space, we obtain frames measuring roughly 1360 by 850 pixels. We can then use the built-in track motion feature of Vegas Pro to scale each video track down to 576 by 360 pixels, which is intentionally of the same aspect ratio, and position them appropriately. The x and y coordinates of a video track to be placed at the i-th row and j-th column can be found easily
Altogether it looks something like this:

For convenience, we render this out in full resolution, and then import it into a second project for the addition of m and n labels. Alternatively one can simply nest this project into the timeline of the second. We render images for the labels using LaTeX, which we add to the timeline.

And now we export the completed video as a image sequence. For those with Photoshop Extended, one can import the image sequence as different layers of an image, and export as a GIF pretty easily. There's a video on how to do this on YouTube. And for those without Photoshop Extended, there's also a way to do this using the free software GIMP, and there's also a video tutorial on how to do this.
In essence the outline of the procedure goes something like:
In GIMP, select File → Open as Layers, and select all of the rendered animation frames. Make sure they are sorted in the right order. Click Open.
Now go to Image → Scale Image, and resize the image to the desired export dimensions.
Go to Image → Mode, and choose Indexed. This is to ensure compatibility with the GIF format. Choose the maximum number of colours—the smaller this number, the small the GIF file size will be, but at the expense of colour quality. Click Convert.
Finally go to File → Export As. Choose the GIF format. Check the As Animation and Loop Forever checkbox, and enter 33 milliseconds as the delay between frames, since our animation was rendered at 30 frames per second. Use this delay for all frames.
Export and it's done.
And this is it. This was how the animation was generated. Till next time, goodbye!